Continuous Systems
In [1]:
%matplotlib inline
import matplotlib.pyplot as plt
import vibration_toolbox as vtb
import numpy as np
In [2]:
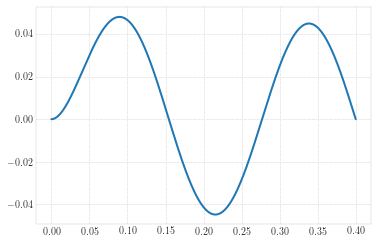
w, x, U = vtb.euler_beam_modes(bctype=3)
plt.plot(x, U[:, 2], '-')
Out[2]:
[<matplotlib.lines.Line2D at 0x116060278>]

In [3]:
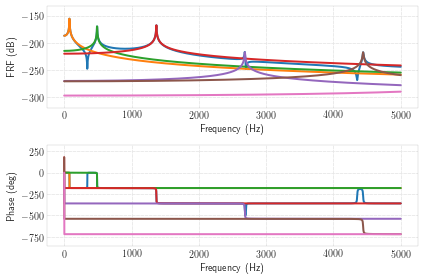
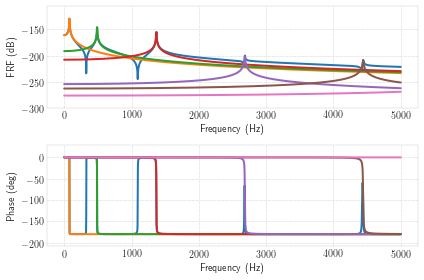
fout, H = vtb.euler_beam_frf(xin=.1, xout=.3, fmax=5000, zeta=0.001)

In [4]:
# This interactivity doesn't work on my Mac as of Oct 12, 2017, but works on linux
from ipywidgets import interact, interactive, fixed, interact_manual
import ipywidgets as widgets


def ebi(xin=.4, xout=.4):
    w, v = vtb.euler_beam_frf(xin=xin, xout=xout, fmax=5000, zeta=0.001)
    plt.show()
In [5]:
w = interactive(ebi, xin=(0.0, 0.4, 0.0005), xout=(0.0, .4, 0.0005))
display(w)

In [ ]: