Single Degree of Freedom
In [1]:
import numpy as np
import vibration_toolbox as vtb
%matplotlib inline
This notebook shows some of the functions for single degree of freedom.
Some interactive functions are available (see the functions with ’_i’ at the end). To see how these interactive functions work we recommend you to download the notebook.
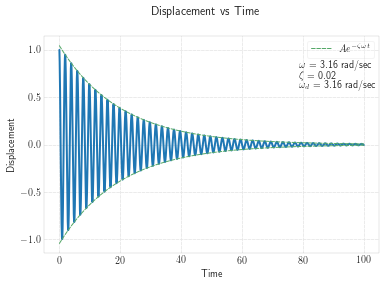
In [2]:
vtb.time_plot()
In [3]:
vtb.time_plot_i()
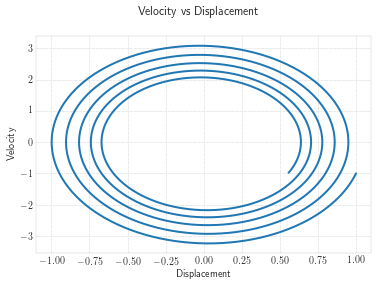
In [4]:
vtb.phase_plot()
In [5]:
vtb.phase_plot_i()
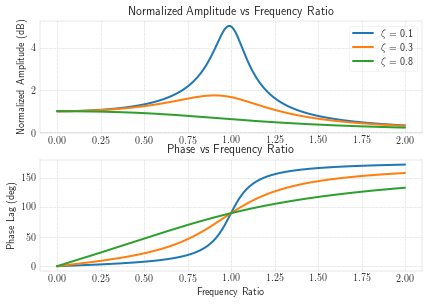
In [6]:
r, A = vtb.steady_state_response(zs=[0.1, 0.3, 0.8], rmin=0, rmax=2)
In [7]:
vtb.steady_state_response_i(zs=(0, 0.5, 0.05), rmin=(0.0,1,0.1), rmax=(0,4.0,0.1))
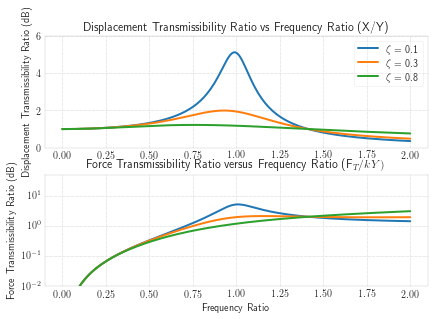
In [8]:
r, D, F = vtb.transmissibility(zs=[0.1, 0.3, 0.8], rmin=0, rmax=2)
In [9]:
vtb.transmissibility_i()
In [10]:
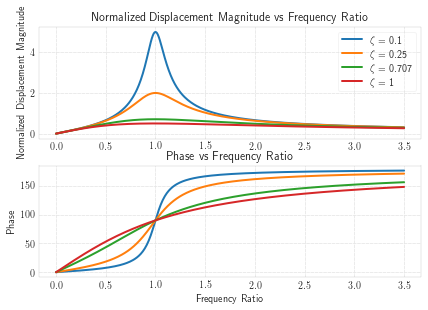
r, Xn = vtb.rotating_unbalance(m=1, m0=0.5, e=0.1, zs=[0.1, 0.25, 0.707, 1], rmin=0, rmax=3.5, normalized=True)
In [11]:
display(vtb.sdof_interact())
In [ ]:
In [ ]: